Prominent Point of ControlAlso called “POC” for short. The level in the futures inside the value area where either the greatest amount of volume traded in the prior session, or the greatest amount of time was spent as measured by the number of TPO’s going across. Measured this way, the POC would be the widest part of any given market profile. While ShadowTrader calculates its value areas and points of control using volume exclusively, we are always very aware of where the TPO POC is and it’s relation to current prices or patterns in the profile. Both are very important.. This is a point of controlAlso called “POC” for short. The level in the futures inside the value area where either the greatest amount of volume traded in the prior session, or the greatest amount of time was spent as measured by the number of TPO’s going across. Measured this way, the POC would be the widest part of any given market profile. While ShadowTrader calculates its value areas and points of control using volume exclusively, we are always very aware of where the TPO POC is and it’s relation to current prices or patterns in the profile. Both are very important. level measured by time and not volume which is very wide relative to other areas of the distribution. It is a price level where every single (or almost every) TPO(MP) Stands for “Time Price Opportunity”. It is the smallest unit of measure displayed any market profile graphic, denoted by a single letter. Each TPO represents a point of time where the market being charted trades at a specific price. A single TPO is printed on the chart every time that a certain price is touched during any time period. Typically, the periods are set to 30 minutes. Therefore, every different letter that you see in the market profile distribution denotes a different 30 minute period. period traded.
Prominent POCs are important as they have greater odds of being tested in subsequent sessions than less prominent POCPoint of Control, also known as the "fairest price to do business". It is the price level in the /ES where the greatest amount of volume in the prior RTH session traded. ShadowTrader measures the POC using volume but the traditional way is to mark off the widest point of the day's distribution where the most TPO's printed going across from left to right, indicating that that was the price where the most time was spent. It's important to pay attention to both the volume POC and the TPO POC. levels.

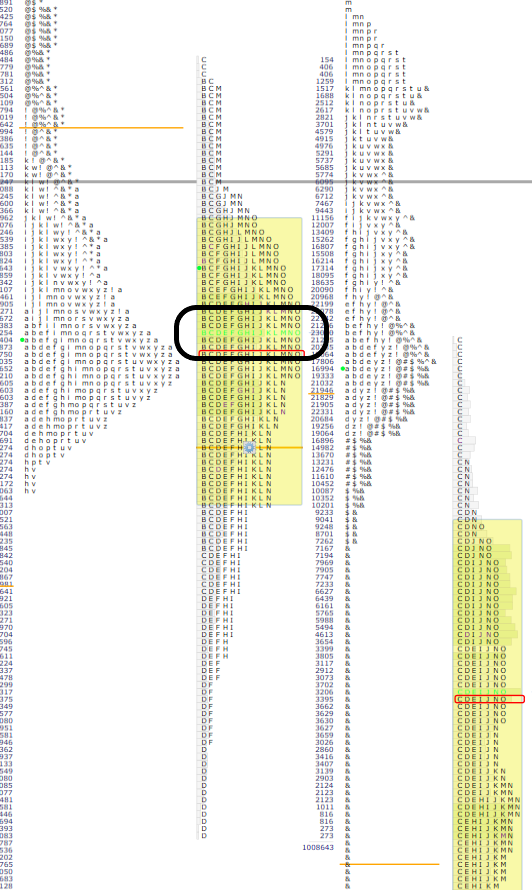
When measuring the POCPoint of Control, also known as the "fairest price to do business". It is the price level in the /ES where the greatest amount of volume in the prior RTH session traded. ShadowTrader measures the POC using volume but the traditional way is to mark off the widest point of the day's distribution where the most TPO's printed going across from left to right, indicating that that was the price where the most time was spent. It's important to pay attention to both the volume POC and the TPO POC. by time and not volume, note that there can be a number of levels that are the same width. In the snapshot above, the green line of TPO’s is where the most volume traded in the session. This is a good level to use as the prominent POCPoint of Control, also known as the "fairest price to do business". It is the price level in the /ES where the greatest amount of volume in the prior RTH session traded. ShadowTrader measures the POC using volume but the traditional way is to mark off the widest point of the day's distribution where the most TPO's printed going across from left to right, indicating that that was the price where the most time was spent. It's important to pay attention to both the volume POC and the TPO POC., keeping in mind that any of the wide areas can be turning points.
If you look closely at the graphic, you can see the in the circled area, every TPO(MP) Stands for “Time Price Opportunity”. It is the smallest unit of measure displayed any market profile graphic, denoted by a single letter. Each TPO represents a point of time where the market being charted trades at a specific price. A single TPO is printed on the chart every time that a certain price is touched during any time period. Typically, the periods are set to 30 minutes. Therefore, every different letter that you see in the market profile distribution denotes a different 30 minute period. period (from B to O) is represented.


