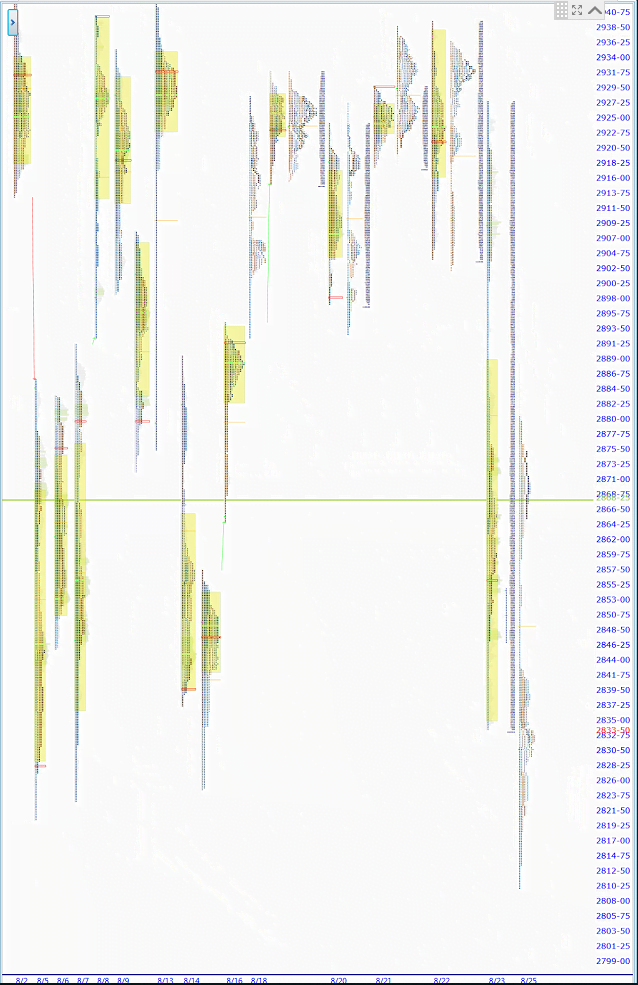
The Market Profile value areas and ShadowTrader Pivots for /ESU19 and /NQU19 Futures are posted free every morning
in the ShadowTrader Swing Trader newsletter.

WindoTrader 702-800-4628 Speak with Terry about the ShadowTrader discount
| 2882.75 | HalfbackA term for the halfway point between the high and low of any session, could be a day session or an overnight session. On Peter's market profile charts it is always a dark yellow horizontal line at that level. |
|---|---|
| 2856.25 | Settlement |
| 2883.75 – 2900.75 | Single PrintsAny section of the market profile distribution that is only one TPO wide. Single prints are a sign of emotional buying or selling as very little time was spent at those levels and thus there is no value there. The endpoints of single print sections are considered to be potential support or resistance points. |
| 2847.00 – 2834.00 | SpikeA set of single prints that are created in the last 30 minute session of the day which form at the top or bottom of a range. |
| 2834.00 | RTHRegular Trading Hours. In the /ES this means the price action from 9:30am EST to 4:15pm EST only. Low |
| 2810.25 | ONLOvernight Low. A term mostly used for the futures market as it trades almost around the clock. To be precise, in the /ES this would be the lowest price between 4:30pm EST and 9:30am EST the next day. |
| 2888.50 | ONHOvernight High. A term mostly used in describing the futures market which has an overnight session and trades almost around the clock. To be precise, in the /ES this is the high made between 4:30pm EST and 9:30am EST the next day. |
**Am traveling again and have early meeting this morning so again this report is being written earlier than normal. There could be a large difference between where I am seeing overnight prices now and 9am EST**
Very wild futures action overnight since the 6pm EST Sunday open where we were down 40 handles in a flash and are now trading higher by about 14 as of this writing at about 5:55am EST. Sensitivity to tariff/trade war news is extremely high right now and with volatility so elevated these swings are quickly becoming the norm. Remember to adjust your targets and stops accordingly regardless of your timeframe outlook.
Whenever there is a large expansion of range in a prior session, my first reference point is almost always halfbackA term for the halfway point between the high and low of any session, could be a day session or an overnight session. On Peter's market profile charts it is always a dark yellow horizontal line at that level.. Think about that for a moment. It’s not just an arbitrary level. It’s the exact level where those proven to be wrong or right become a majority. Think of it as a tipping point. Currently we are trading above the settlement and below halfbackA term for the halfway point between the high and low of any session, could be a day session or an overnight session. On Peter's market profile charts it is always a dark yellow horizontal line at that level.. So my first thought this morning is that there will probably be a little clash between those covering shorts because are above the open and those adding to them because we are below halfbackA term for the halfway point between the high and low of any session, could be a day session or an overnight session. On Peter's market profile charts it is always a dark yellow horizontal line at that level.. Within those last few phrases is encapsulated my entire trading philosophy. Figure out the key levels and then decide if crossing them will embolden one side or the other. Then apply context to that.
The next area that is of importance is Friday’s RTHRegular Trading Hours. In the /ES this means the price action from 9:30am EST to 4:15pm EST only. low. If halfbackA term for the halfway point between the high and low of any session, could be a day session or an overnight session. On Peter's market profile charts it is always a dark yellow horizontal line at that level. is the tipping point where a majority becomes wrong or right, then RTHRegular Trading Hours. In the /ES this means the price action from 9:30am EST to 4:15pm EST only. low or high of a trending day is where that majority becomes close to 100%. Huge piece of market generated information there….
The last two areas of importance today are the single printsAny section of the market profile distribution that is only one TPO wide. Single prints are a sign of emotional buying or selling as very little time was spent at those levels and thus there is no value there. The endpoints of single print sections are considered to be potential support or resistance points. in Friday’s distribution. There are two sets of them and one is a spikeA set of single prints that are created in the last 30 minute session of the day which form at the top or bottom of a range. which puts spike rulesA framework for analyzing a spike on the next trading day after it is formed.
Because the spike forms late in the day, it is impossible to gauge whether or not the higher or lower prices that have run quickly away from value will be deemed fair later. Thus we employ the spike rules in the next session.
Everything below is assuming a spike at the TOP of a daily range (reverse for a spike at the BOTTOM of a range)
-If prices open above the spike, that is considered bullish and tells us that prices didn't auction high enough in the spike to attract sellers and cut off buying activity. Monitor to see if there is acceptance above the spike.
-Prices opening within the spike confirm the higher prices of the spike. This tells us that the prices are fair enough for two sided... into play. To refresh, a spikeA set of single prints that are created in the last 30 minute session of the day which form at the top or bottom of a range. is when you have single printsAny section of the market profile distribution that is only one TPO wide. Single prints are a sign of emotional buying or selling as very little time was spent at those levels and thus there is no value there. The endpoints of single print sections are considered to be potential support or resistance points. into the last one or two periods of a session. While we didn’t close near the lows, note that there was a large excess made in “N” period which is the last TPO(MP) Stands for “Time Price Opportunity”. It is the smallest unit of measure displayed any market profile graphic, denoted by a single letter. Each TPO represents a point of time where the market being charted trades at a specific price. A single TPO is printed on the chart every time that a certain price is touched during any time period. Typically, the periods are set to 30 minutes. Therefore, every different letter that you see in the market profile distribution denotes a different 30 minute period. period before the shortened “o” period. Both sets of single printsAny section of the market profile distribution that is only one TPO wide. Single prints are a sign of emotional buying or selling as very little time was spent at those levels and thus there is no value there. The endpoints of single print sections are considered to be potential support or resistance points. should be considered today both for their short and longer term implications; the upper single printsAny section of the market profile distribution that is only one TPO wide. Single prints are a sign of emotional buying or selling as very little time was spent at those levels and thus there is no value there. The endpoints of single print sections are considered to be potential support or resistance points. being a more short term signal and the spikeA set of single prints that are created in the last 30 minute session of the day which form at the top or bottom of a range. being a more longer term one. In a nutshell, extremes of single printsAny section of the market profile distribution that is only one TPO wide. Single prints are a sign of emotional buying or selling as very little time was spent at those levels and thus there is no value there. The endpoints of single print sections are considered to be potential support or resistance points. are often marked off as intraday support or resistance and how we trade in relation to spikes often determines slightly longer term direction as the spikes are either accepted or rejected.
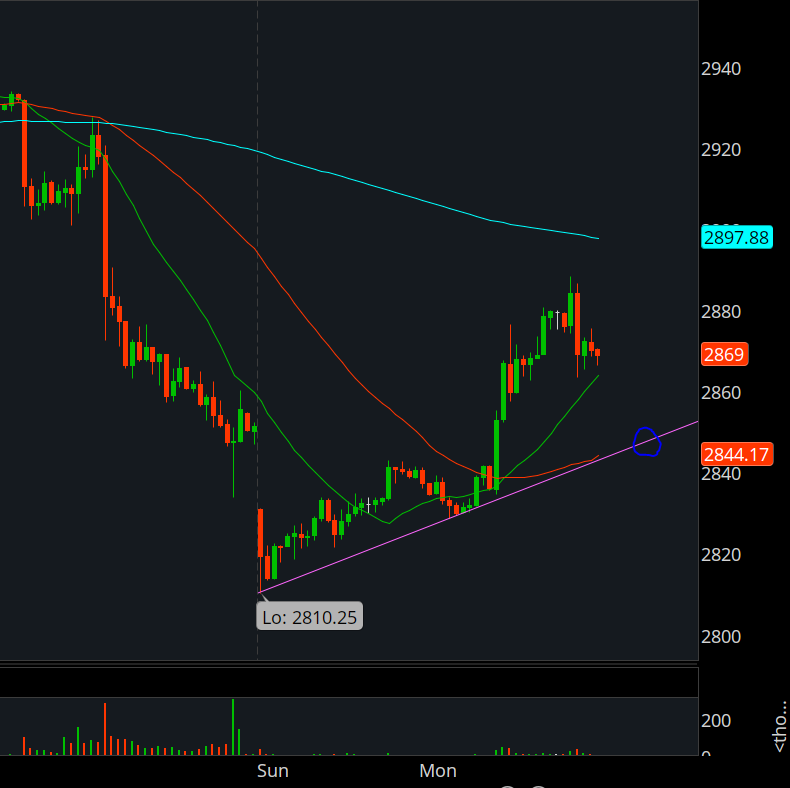
As there are always limitations to every chart view (profile. candlestick, point and figure, whatever…) I leave you with a more traditional chart of the /ES that shows the overnight action and more importantly where the trendline lies that connects the Sunday night lows. This chart is self explanatory and should also figure into your analysis today.

/ES 15 minute [overnight session]
I’ve said a lot here and I think it’s of huge valueThis value has nothing to do with valuation. It denotes prices that are "fair". Fair in this sense means a price that is common to a lot of participants. An item that you buy once per week in a store at a price that doesn't fluctuate has a "fair price". You can express this by a formula Value = Price + Time or Value = Price + Volume Either of the above are valid ways of expressing value. In the first equation, value is defined by price staying the same for a long period of time. In the futures market, this would be an area that is revisted a lot during a particular session or multiple sessions. The point of control is the price level where the most amount of time was spent during an RTH session. James Dalton refers to this level as "the fairest price to do business". Using vo... More. I’ve noticed that many of you have taken a free trial for the first time over the weekend. I sincerely welcome you and I hope that my daily writings will inspire you to look at price action with a more discerning eye and lead you to greater market understanding which you can leverage to your advantage.
Scenarios
- Overnight trade is in a very large range and trading between halfbackA term for the halfway point between the high and low of any session, could be a day session or an overnight session. On Peter's market profile charts it is always a dark yellow horizontal line at that level. and the settlement. Given that and the current levels of volatility, I would be looking for slightly later rather than earlier trade today. That being said, gaps up against bearish prior days often fadeWhen a stock moves opposite the direction of its gap on an intraday basis from the open especially when overnight inventoryA way of measuring overnight activity in the futures market by just noting how much of the overnight activity happens to fall above the prior day's settlement value (4:15pm EST close) and how much falls below. If more activity is above the settlement, then overnight inventory is said to be net long. If more is below, then it is said to be net short. If all of the overnight activity is above the settlement, then it is said to be 100% net long. If all of the activity is below the settlement then it is said to be 100% net short. The overnight inventory situation matters most and has the most impact on early trade when it is skewed 100% in either direction because when the imbalance is very large like that then the odds of an early correction increase greatly. This is due to the fact that most... is relatively balanced as it is today.
- The ONHOvernight High. A term mostly used in describing the futures market which has an overnight session and trades almost around the clock. To be precise, in the /ES this is the high made between 4:30pm EST and 9:30am EST the next day. is marking inside of the single printsAny section of the market profile distribution that is only one TPO wide. Single prints are a sign of emotional buying or selling as very little time was spent at those levels and thus there is no value there. The endpoints of single print sections are considered to be potential support or resistance points.. A breach of it on strength would put the rest of the single printsAny section of the market profile distribution that is only one TPO wide. Single prints are a sign of emotional buying or selling as very little time was spent at those levels and thus there is no value there. The endpoints of single print sections are considered to be potential support or resistance points. into play on up to their top.
- Any balancing relatively close to the settlement that doesn’t breach the extremes of the overnight range should be carried forward as bearish. I would also think that acceptanceWhen the market profile begins to build out or develop in a certain area, it is said that the market is accepting those prices. This can be measured either in time spent or amount of volume that is transacted. It is generally understood that ShadowTrader defines acceptance as more of a time dynamic than a volume one. A good rule of thumb is to look for at least two TPO periods to print in the accepted area. The acceptance confirms that a significant amount of market participants are transacting at those levels. Acceptance is the opposite of rejection. More below today’s settlement will embolden sellers and potentially bring more of them to the party.
Have a money Monday,
Peter

A Bet and a Victor eBook
Best way to dip your toe into the ocean of Trading Psychology for a tiny price. Follow protagonist Victor and see how many of his trading psychology pitfalls you recognize!
$20 - Get Yours Today


