The Market Profile value areas and ShadowTrader Pivots for /ESM20 and /NQM20 Futures are posted free every morning
in the ShadowTrader Swing Trader newsletter.

WindoTrader 702-800-4628 Speak with Terry about the ShadowTrader discount
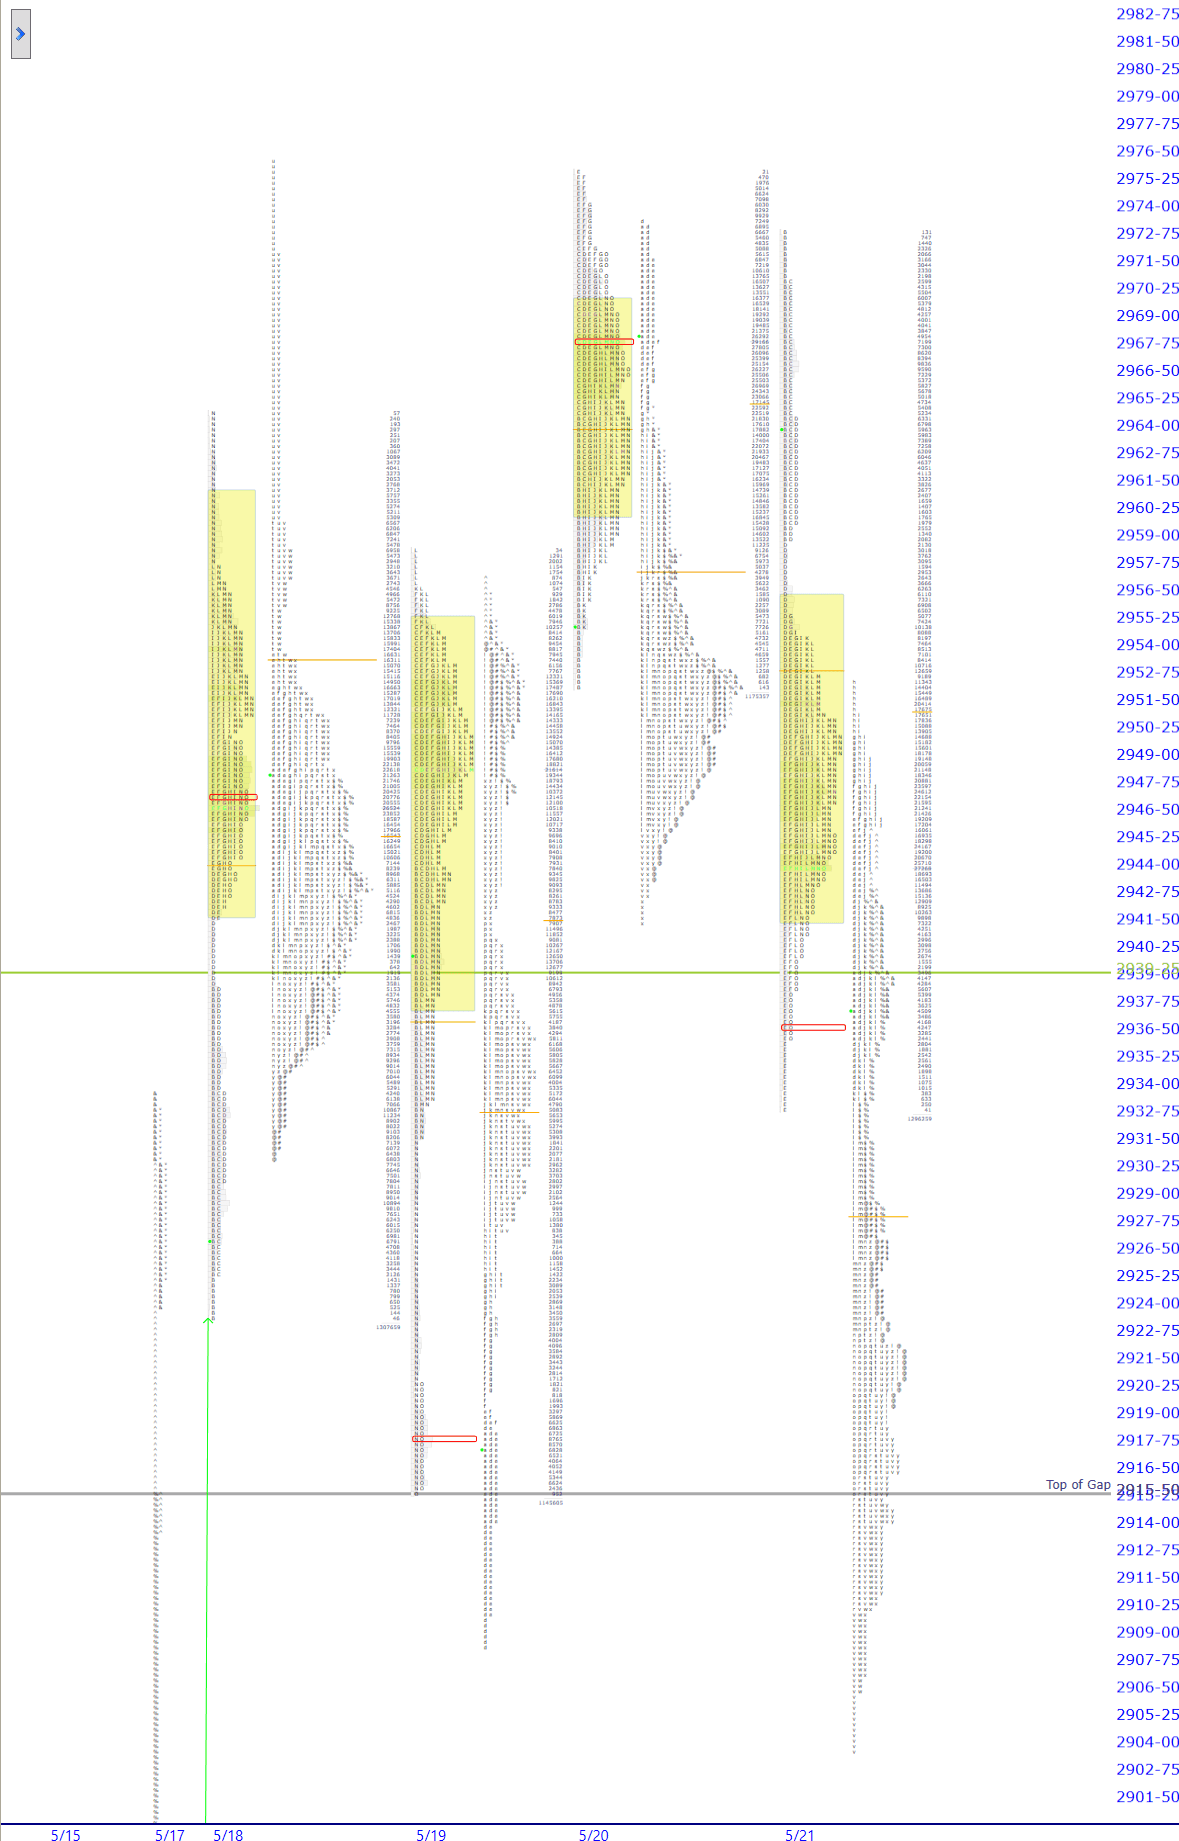
| 2976.25 | 5/18 overnight high/ 5/20,21 RTHRegular Trading Hours. In the /ES this means the price action from 9:30am EST to 4:15pm EST only. High |
|---|---|
| 2955.75 | Start of Single PrintsAny section of the market profile distribution that is only one TPO wide. Single prints are a sign of emotional buying or selling as very little time was spent at those levels and thus there is no value there. The endpoints of single print sections are considered to be potential support or resistance points. |
| 2933.00 | RTHRegular Trading Hours. In the /ES this means the price action from 9:30am EST to 4:15pm EST only. Low |
| 2915.50 | Top of Gap |
| 2903.75 | ONLOvernight Low. A term mostly used for the futures market as it trades almost around the clock. To be precise, in the /ES this would be the lowest price between 4:30pm EST and 9:30am EST the next day. |
Plenty of nuance to discuss in yesterday’s distribution not to mention the glaring piece of M.G.I.Market Generated Information. that is the continued failure to fill more of the gap. As I like to say, “without further ado, let’s get into it!”
As of now we are slated to open in balance. Overnight inventoryA way of measuring overnight activity in the futures market by just noting how much of the overnight activity happens to fall above the prior day's settlement value (4:15pm EST close) and how much falls below. If more activity is above the settlement, then overnight inventory is said to be net long. If more is below, then it is said to be net short. If all of the overnight activity is above the settlement, then it is said to be 100% net long. If all of the activity is below the settlement then it is said to be 100% net short. The overnight inventory situation matters most and has the most impact on early trade when it is skewed 100% in either direction because when the imbalance is very large like that then the odds of an early correction increase greatly. This is due to the fact that most... is net shortThe concept of being more short than long in an options spread by creating options spreads where you are selling more structures than you are buying or selling wider structures than the ones you are buying. Example would be a broken wing butterfly. This spread is made up of two structures, one long vertical and one short vertical. In the BWB, the short vertical is wider than the long vertical. When you are long this spread, you are said to be in an options position that is "net short"
but not skewed enough to matter at the open, I don’t think. It’s the last bit of overnight analysis that is noteworthy which is to see how far away we are from the ONHOvernight High. A term mostly used in describing the futures market which has an overnight session and trades almost around the clock. To be precise, in the /ES this is the high made between 4:30pm EST and 9:30am EST the next day. or ONLOvernight Low. A term mostly used for the futures market as it trades almost around the clock. To be precise, in the /ES this would be the lowest price between 4:30pm EST and 9:30am EST the next day.. In today’s case, it’s the ONLOvernight Low. A term mostly used for the futures market as it trades almost around the clock. To be precise, in the /ES this would be the lowest price between 4:30pm EST and 9:30am EST the next day. that matters because once again the overnight trade has ventured into the gap which is a void of price support and rejected back higher into range. That is a classic WWSHDWhen What Should Happen Doesn't - A market dynamic where prices defy what is normally expected of them given the specific context they are in. A good example would be filling a larger gap only partially. The thinking is that the failure to do what should happen means prices are potentially headed in the other direction. moment and should be carried forward.
Moving to within the distribution I am seeing that there are some single printsAny section of the market profile distribution that is only one TPO wide. Single prints are a sign of emotional buying or selling as very little time was spent at those levels and thus there is no value there. The endpoints of single print sections are considered to be potential support or resistance points. at the top which has formed the shape of the distribution into a lower case “b”. B stands for liquidation BREAKA sudden selloff in the market that has the following characteristics:
-Often happens very early or late in the day
-Comes out of a pattern that doesn’t suggest such a break should occur
-Has no definitive catalyst or news that drives it
-Has much faster tempo than the one that has already been established
-Is often short-lived and will retrace 100% soon after or the next day
A liquidation break happens when short term traders get overly long and all panic out at once. It is different from a stronger, more lasting correction in that there are usually only very short timeframe players involved, usually those who got most recently long at poor location.. Imagine if there was a Sesame Street episode that was devoted to market profileA way of reading the market that recognizes either time spent or volume traded at a particular price level. A market profile can be either made up of “TPO’s” (time price opportunities), or volume. TPO’s measure how much time was spent at a particular price, while volume-based market profiles measure how much volume traded at a particular price. Generally, market profile is used in the trading of futures, especially the /ES. ShadowTrader utilizes volume based profiles..
Single printsAny section of the market profile distribution that is only one TPO wide. Single prints are a sign of emotional buying or selling as very little time was spent at those levels and thus there is no value there. The endpoints of single print sections are considered to be potential support or resistance points. are always to be carried forward into the next day as potential resistance points. If prices can get up to the start of that skinny section of the profile, there is potential that the area will be resistant.
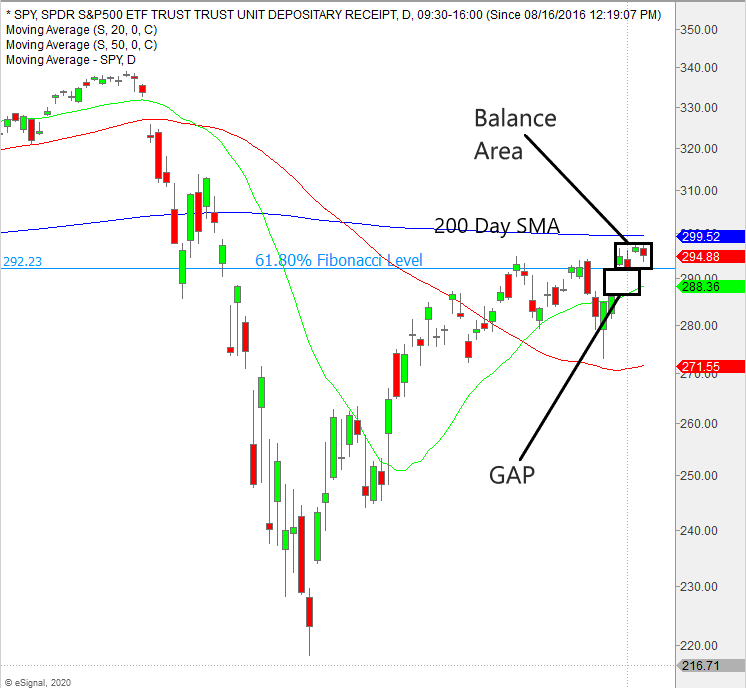
As there seems to be a whole lotta back and forth lately it would be good to step back and look at a daily at this juncture. Let’s use SPY since we know that it is trading hours only which is what matters most.

SPY Daily with Fibonacci Retracement and Moving Averages
I’ve marked up the chart to show what I believe are the three most important technical nuances that the market is focusing on right now. The market has rallied off of the lows and taken a couple of attempts to break above the 61.80% Fibonacci resistance. In finally taking it out it did so on a monster gap higher that has since held and is now balancing for four sessions. The 200 day SMA just above which ties in with the round 300 level (3,000 in SPX) is just above the balance area and is the obvious target for the market.
When looking at a daily chart which zooms out a bit, we can see that the technical picture is still pretty bullish as the gap remains unfilled and the market has been trading in a relatively small range just above the 61.80% Fib level.
Scenarios
- I am considering the last four sessions as a large balance area and thus balance rulesWhen a market is in balance, meaning that it is consolidating in a tight range of two or more days, then balance rules apply. The balance rules are nothing more than a framework of scenarios that could happen which prepare us for every possible outcome.
The possible outcomes and how to trade them are:
1. Look above and go. Prices move above the high of balance and find acceptance and continue higher. The target should be double the balance area.
2. Look above and fail. Prices move above the balance high but fail to find acceptance and reverse back into the balance area. This is now a short with a stop above the high just outside of balance that was recently made, with a target to the opposing low end of the balance area.
3. Look below and go. Prices move below the ... are in play. I know that any activity within the balance area may be responsive and that the market has been very susceptible to liquidation breaks within the area. - On any strength today, my focus will be on the single print area at the higher end of the distribution to see if we can trade through it and get to the recent multiple touch resistance of the first Key Level above. I will treat this level as a breakout point and assume that the market is targeting SPX 3,000 on any acceptanceWhen the market profile begins to build out or develop in a certain area, it is said that the market is accepting those prices. This can be measured either in time spent or amount of volume that is transacted. It is generally understood that ShadowTrader defines acceptance as more of a time dynamic than a volume one. A good rule of thumb is to look for at least two TPO periods to print in the accepted area. The acceptance confirms that a significant amount of market participants are transacting at those levels. Acceptance is the opposite of rejection. More above this level.
- Taking out the RTHRegular Trading Hours. In the /ES this means the price action from 9:30am EST to 4:15pm EST only. Low has less import today since it is not the low of the balance area and I know that the ONLOvernight Low. A term mostly used for the futures market as it trades almost around the clock. To be precise, in the /ES this would be the lowest price between 4:30pm EST and 9:30am EST the next day. is well further down. While I am working from the framework that there are not stronger sellers inside of the gap (or else it would have filled more already), I stand ready to change my intraday (and potentially longer term) bias if we find acceptanceWhen the market profile begins to build out or develop in a certain area, it is said that the market is accepting those prices. This can be measured either in time spent or amount of volume that is transacted. It is generally understood that ShadowTrader defines acceptance as more of a time dynamic than a volume one. A good rule of thumb is to look for at least two TPO periods to print in the accepted area. The acceptance confirms that a significant amount of market participants are transacting at those levels. Acceptance is the opposite of rejection. More below the ONLOvernight Low. A term mostly used for the futures market as it trades almost around the clock. To be precise, in the /ES this would be the lowest price between 4:30pm EST and 9:30am EST the next day.. In such a scenario, the full gap fill (2859.50) would come into play.

ShadowTrader Weekly Options Advisory
-Real time text messages on all entries, exits, and adjustments
-Private, members-only webinars every Thursday
-Includes 2-3 "What's Peter Thinking" recorded audio updates daily!
$49 per month


