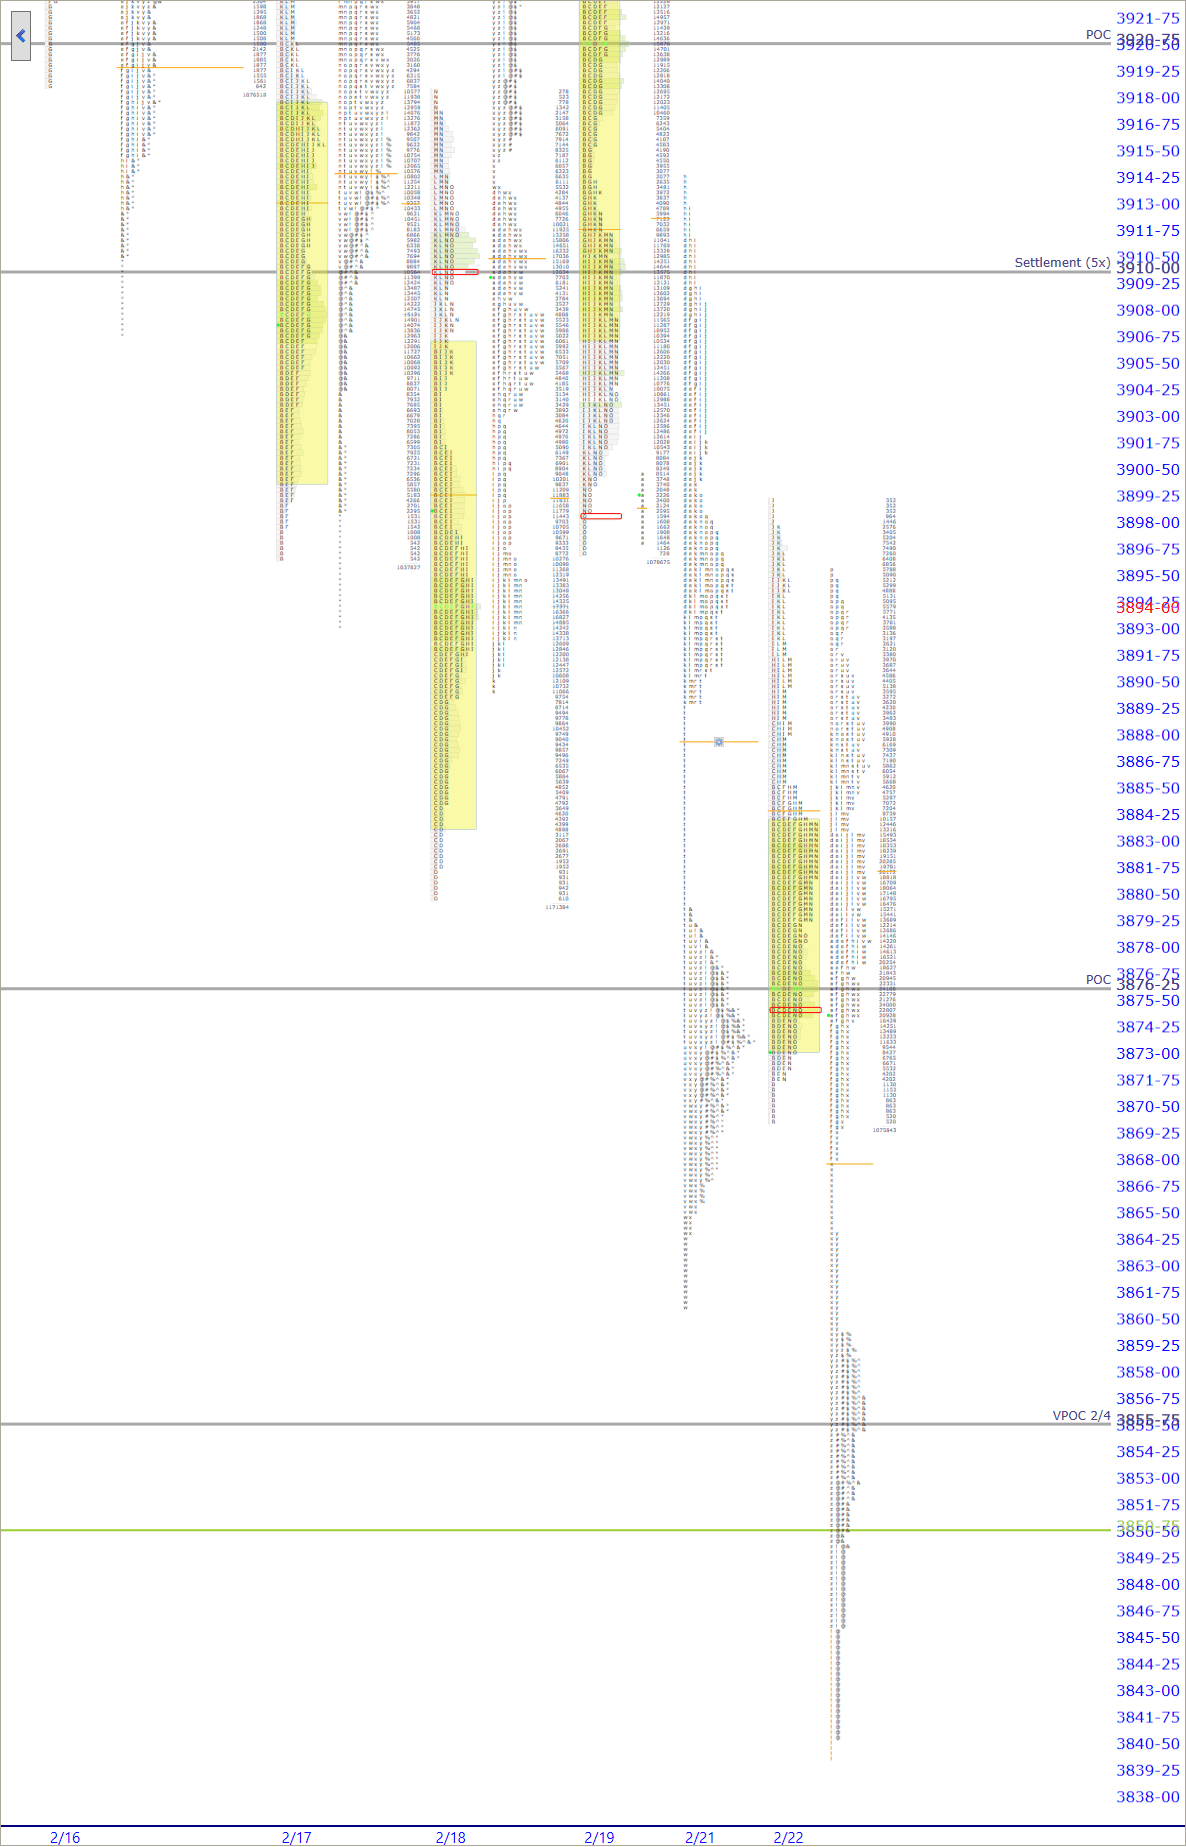
The Market Profile value areas and ShadowTrader Pivots for /ESH21 and /NQH21 Futures are posted free every morning
in the ShadowTrader Swing Trader newsletter.

WindoTrader 702-800-4628 Speak with Terry about the ShadowTrader discount
| 3870.00 | RTHRegular Trading Hours. In the /ES this means the price action from 9:30am EST to 4:15pm EST only. Low |
|---|---|
| 3868.00 | Overnight HalfbackA term for the halfway point between the high and low of any session, could be a day session or an overnight session. On Peter's market profile charts it is always a dark yellow horizontal line at that level. |
| 3840.00 | ONLOvernight Low. A term mostly used for the futures market as it trades almost around the clock. To be precise, in the /ES this would be the lowest price between 4:30pm EST and 9:30am EST the next day. |
| 3827.00 | VPOCVirgin Point of Control. This is a point of control level that has not yet been tested (traded through) during an RTH session. If the POC gets tested during an overnight session, it does not count and remains "virgin" until it happens during a day session. 2.3 |
TSLA doesn’t like Bitcoin falling, tech stocks don’t like interest rates rising but financials do so hence /ES down 0.44% while /NQ down 1.60%. That’s the situation in a nutshell.
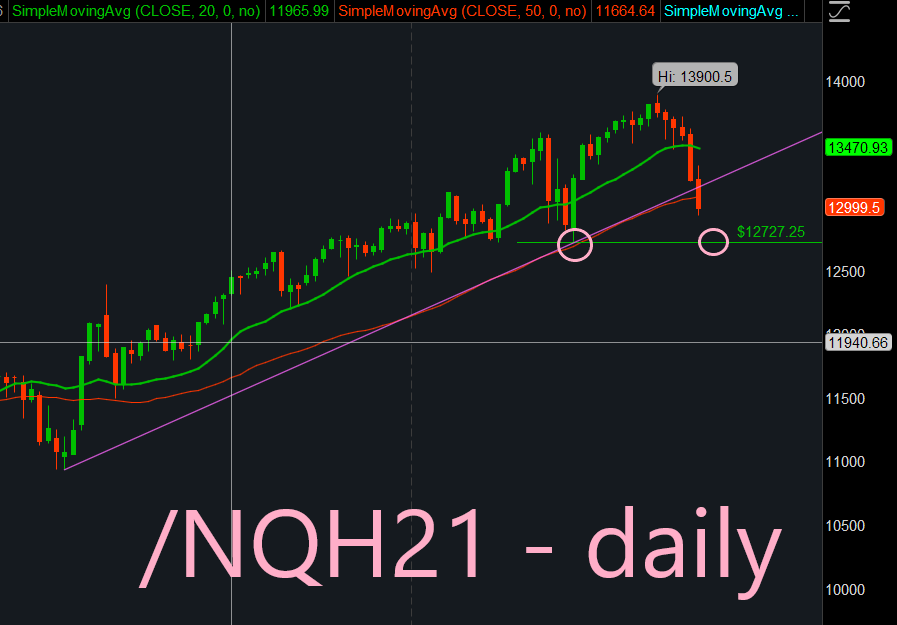
In yesterday’s Premarket Perspective I included a chart of the /NQH21 showing a potential test of trendline support. That trendline was violated last night and current prices are well below. Let’s start with that chart again before we slice things up on a more granular level…

The chart above shows the break in trend and the loss of the 50SMA daily as well. I’ve drawn in the next support level at that prior low. Note that this would be a major support as it is a pullback low that precedes a higher high. Keep that firmly in mind as as potential buy point for a slightly longer term trade.
As of now we are slated to open out of balance both out of yesterday’s RTHRegular Trading Hours. In the /ES this means the price action from 9:30am EST to 4:15pm EST only. range and any larger balance area. Overnight inventoryA way of measuring overnight activity in the futures market by just noting how much of the overnight activity happens to fall above the prior day's settlement value (4:15pm EST close) and how much falls below. If more activity is above the settlement, then overnight inventory is said to be net long. If more is below, then it is said to be net short. If all of the overnight activity is above the settlement, then it is said to be 100% net long. If all of the activity is below the settlement then it is said to be 100% net short. The overnight inventory situation matters most and has the most impact on early trade when it is skewed 100% in either direction because when the imbalance is very large like that then the odds of an early correction increase greatly. This is due to the fact that most... is very balanced and we are currently trading in the lower third of the overnight range. The most important takeaway from the three premarket questions1. Are we opening in or out of balance. This is defined by both the prior day's RTH range and any larger recent balance area should it exist.
2. Is overnight inventory net long or net short and by how much?
3. Where in relation to the entire overnight range are futures trading currently?
is that the overnight inventoryA way of measuring overnight activity in the futures market by just noting how much of the overnight activity happens to fall above the prior day's settlement value (4:15pm EST close) and how much falls below. If more activity is above the settlement, then overnight inventory is said to be net long. If more is below, then it is said to be net short. If all of the overnight activity is above the settlement, then it is said to be 100% net long. If all of the activity is below the settlement then it is said to be 100% net short. The overnight inventory situation matters most and has the most impact on early trade when it is skewed 100% in either direction because when the imbalance is very large like that then the odds of an early correction increase greatly. This is due to the fact that most... is very balanced. This takes away from the shock and aweA term Peter uses to describe what overnight futures traders may be feeling when faced with an open that is wildly divergent from what they expected. Large gaps in either direction that are opening well outside of range are examples of this. The approach is that when the market opens in such a manner, there is often opportunity to trade earlier rather than later because of the large contingent of traders who will be forced to reverse their positions quickly. of the open and may put a damper on any short covering.
Overall my feel here is that the /ES doesn’t really want to sell off and has much stronger underpinnings from sectors that are currently rallying and holding at new highs. The problem is the XLK which makes up almost 30% of the SPX and is obviously acting as a drag.
Scenarios
- Gap rulesGuidelines to follow on any day that the futures open outside of the prior day's RTH range. Only opening outside of range is a true gap and puts gap rules in play. 1. Go with all gaps that don't fill right away. This means that if early trade doesn't start to correct the imbalance, then prices will probably move in the direction of the gap. 2. Larger gaps can often fail to fill on the first day or may fill only partially. 3. If the gap fills (meaning the prior day's RTH high is touched on a gap up or the prior day's RTH low is touched on a gap down) and value cannot get to at least overlapping, then the odds of a late day rally (on a gap up) or late day selloff (on a gap down) increase. 4. Gaps of larger than $20 in the /ES are difficult to trade and should be avoided early in the day as t... More are in play. Be careful with any early attempt at fill. There is large divergence between the futures and this can often cause moves that are harder to predict. Let the gap rulesGuidelines to follow on any day that the futures open outside of the prior day's RTH range. Only opening outside of range is a true gap and puts gap rules in play. 1. Go with all gaps that don't fill right away. This means that if early trade doesn't start to correct the imbalance, then prices will probably move in the direction of the gap. 2. Larger gaps can often fail to fill on the first day or may fill only partially. 3. If the gap fills (meaning the prior day's RTH high is touched on a gap up or the prior day's RTH low is touched on a gap down) and value cannot get to at least overlapping, then the odds of a late day rally (on a gap up) or late day selloff (on a gap down) increase. 4. Gaps of larger than $20 in the /ES are difficult to trade and should be avoided early in the day as t... More be your guide with the usual emphasis on #2 and #4.
- If there is counter-trend action, monitor closely for continuation and target the full gap fill at the RTHRegular Trading Hours. In the /ES this means the price action from 9:30am EST to 4:15pm EST only. Low. Take it step by step from there on any further strength.
- Any gap and go continuation scenario will be coupled with extremely bearish internalsInternals refers to “market internals” and is a blanket term to collectively describe the advance decline, breadth, tick and cumulative tick. and a partial to no gap fill in early trade. I can’t stress enough (like yesterday) that this is a hard play to pull off early as the natural tendency of the market is to take care of old businessAny transactions in the market that are closing or adjusting positions that were already entered in a previous session. This is in contrast to "new business" which is the term for trades by market participants who are entering a new position in a security for the first time. It is a general rule that the market transacts old business before it transacts new business. We see this most clearly on large gaps in the futures market. When those gaps fill, that is old business being transacted as the overnight traders are taking profits on positions that they already entered prior to the RTH session starting. More first which is to deal with the overnight shorts in the gap.

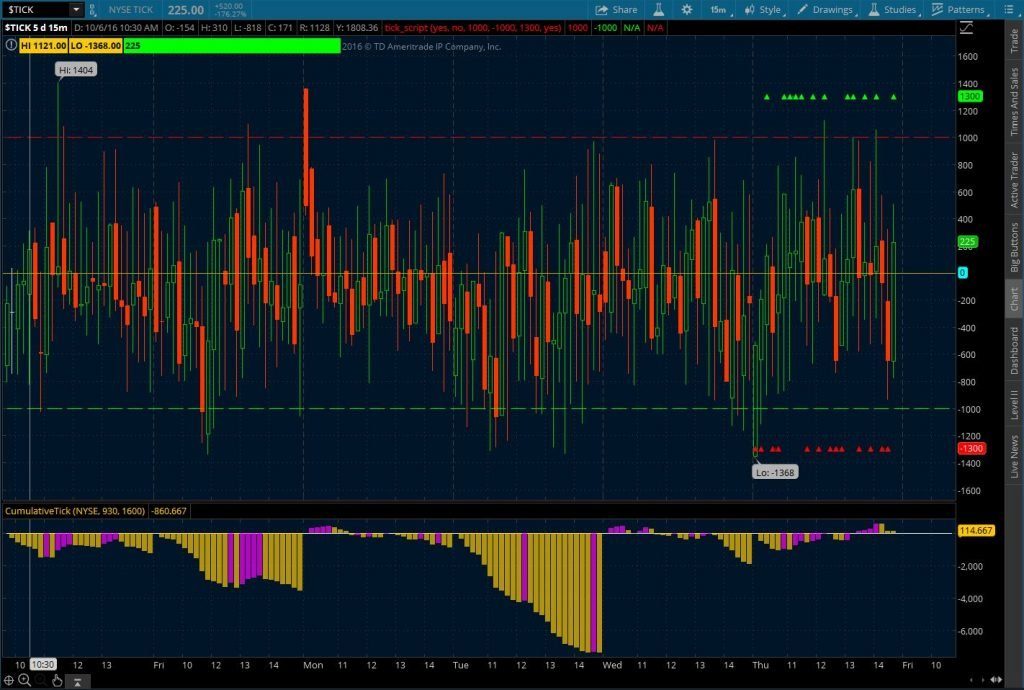
ShadowTrader Cumulative Tick
Beef up your "quad" and by putting your tickThe net cumulative tick reading on the NYSE or Nasdaq Composite. This is measured by the number of stocks ticking up minus the number of stocks ticking down at any given moment. It is the least used of the internal indicators but is discussed from time to time. Generally the tick readings are only helpful when they are at extremes such as +1000 on the NYSE to indicate that program trading is ensuing. indicator on steroids!
Learn More


