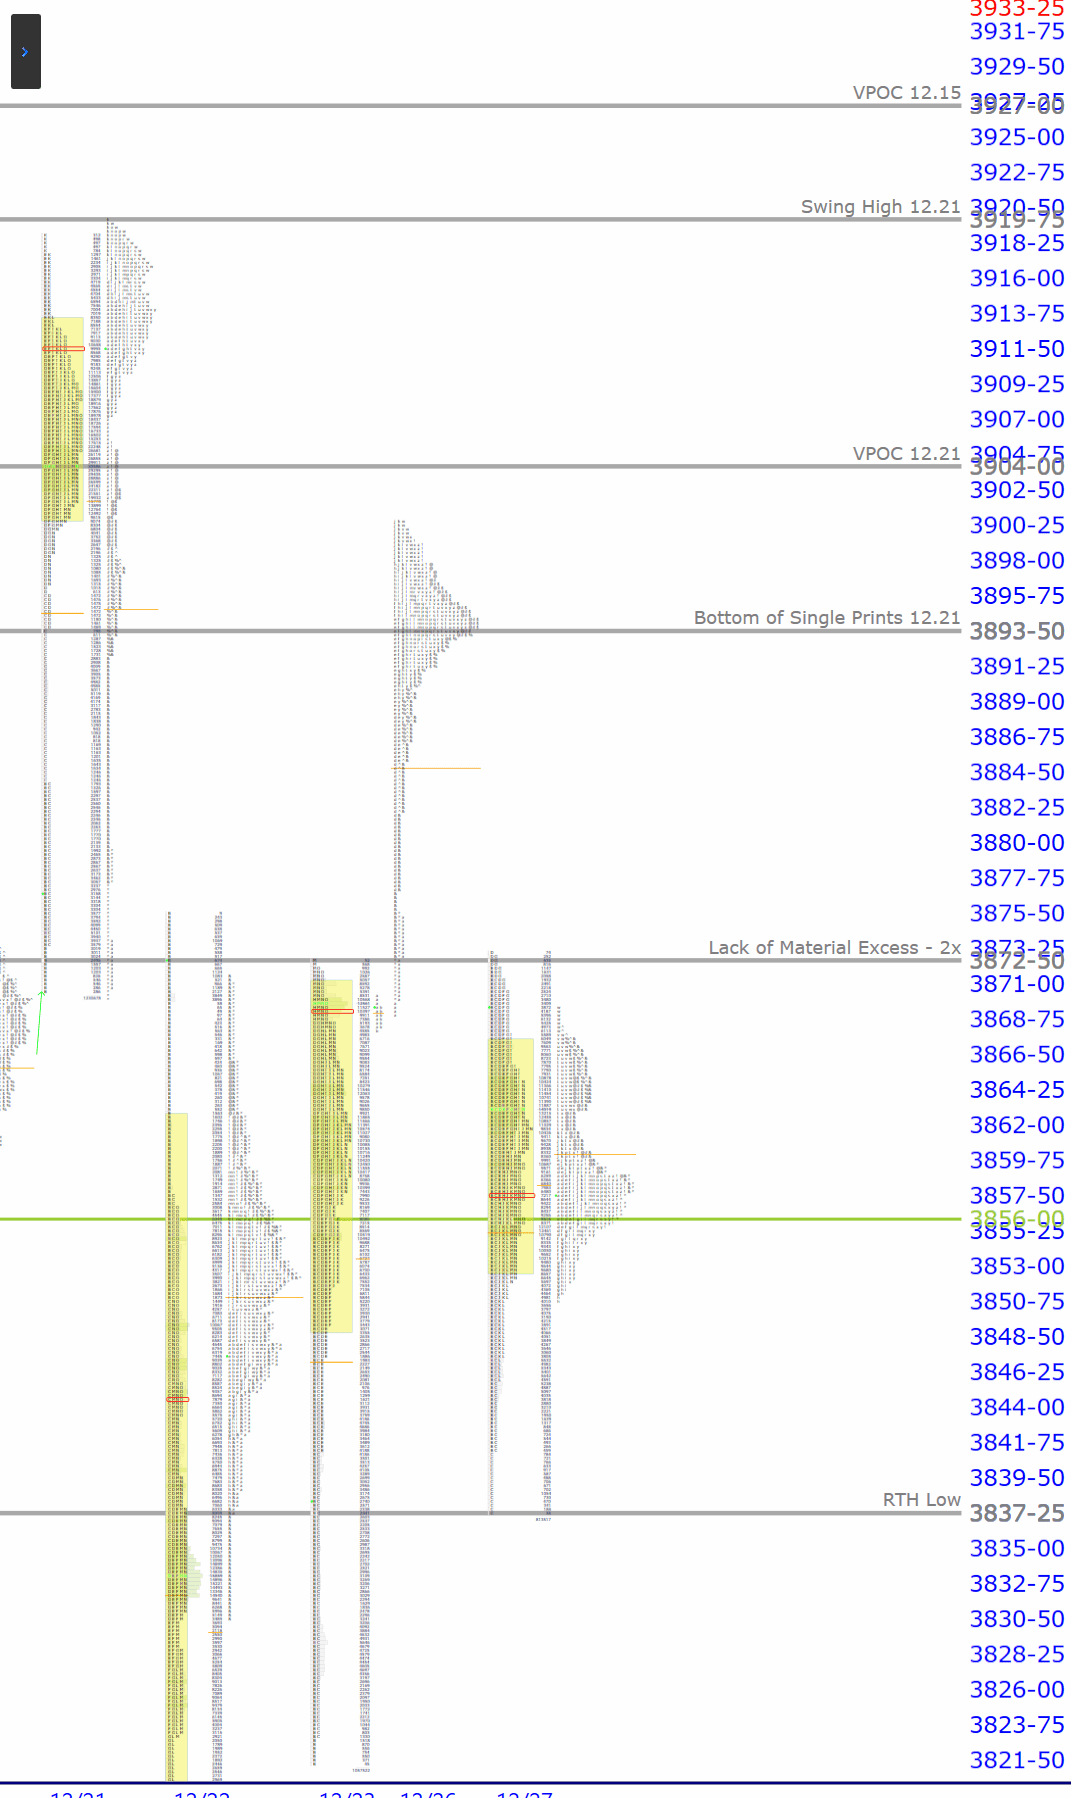
The Market ProfileA way of reading the market that recognizes either time spent or volume traded at a particular price level. A market profile can be either made up of “TPO’s” (time price opportunities), or volume. TPO’s measure how much time was spent at a particular price, while volume-based market profiles measure how much volume traded at a particular price. Generally, market profile is used in the trading of futures, especially the /ES. ShadowTrader utilizes volume based profiles. valueThis value has nothing to do with valuation. It denotes prices that are "fair". Fair in this sense means a price that is common to a lot of participants. An item that you buy once per week in a store at a price that doesn't fluctuate has a "fair price". You can express this by a formula Value = Price + Time or Value = Price + Volume Either of the above are valid ways of expressing value. In the first equation, value is defined by price staying the same for a long period of time. In the futures market, this would be an area that is revisted a lot during a particular session or multiple sessions. The point of control is the price level where the most amount of time was spent during an RTH session. James Dalton refers to this level as "the fairest price to do business". Using vo... More areas and ShadowTrader Pivots for /ESH23 and /NQH23 Futures are posted free every morning in the ShadowTrader Swing Trader newsletter.

WindoTrader 702-800-4628 Speak with Terry about the ShadowTrader discount or CLICK HERE to learn more.
Click HERE for a market profile key that will help you interpret the chart above.
Pre market indications
| Opening In/Out Balance | in balance |
|---|---|
| Overnight InventoryA way of measuring overnight activity in the futures market by just noting how much of the overnight activity happens to fall above the prior day's settlement value (4:15pm EST close) and how much falls below. If more activity is above the settlement, then overnight inventory is said to be net long. If more is below, then it is said to be net short. If all of the overnight activity is above the settlement, then it is said to be 100% net long. If all of the activity is below the settlement then it is said to be 100% net short. The overnight inventory situation matters most and has the most impact on early trade when it is skewed 100% in either direction because when the imbalance is very large like that then the odds of an early correction increase greatly. This is due to the fact that most... | balanced |
| Current Price/Overnight Range | upper third |
| Shock and AweA term Peter uses to describe what overnight futures traders may be feeling when faced with an open that is wildly divergent from what they expected. Large gaps in either direction that are opening well outside of range are examples of this. The approach is that when the market opens in such a manner, there is often opportunity to trade earlier rather than later because of the large contingent of traders who will be forced to reverse their positions quickly. | no |
| Potential for Early Trade | no |
| Short Term Bias | neutral to bearish |
Key Levels for Today
| 3904.00 | VPOCVirgin Point of Control. This is a point of control level that has not yet been tested (traded through) during an RTH session. If the POC gets tested during an overnight session, it does not count and remains "virgin" until it happens during a day session. 12.21 |
|---|---|
| 3893.50 | Bottom of Single PrintsAny section of the market profile distribution that is only one TPO wide. Single prints are a sign of emotional buying or selling as very little time was spent at those levels and thus there is no value there. The endpoints of single print sections are considered to be potential support or resistance points. 12.21 |
| 3872.50 | Double Top / Lack of Material Excess (2x) |
| 3837.25 | RTHRegular Trading Hours. In the /ES this means the price action from 9:30am EST to 4:15pm EST only. Low |
Ongoing Narrative / Commentary
Flattish open on very balanced overnight inventoryA way of measuring overnight activity in the futures market by just noting how much of the overnight activity happens to fall above the prior day's settlement value (4:15pm EST close) and how much falls below. If more activity is above the settlement, then overnight inventory is said to be net long. If more is below, then it is said to be net short. If all of the overnight activity is above the settlement, then it is said to be 100% net long. If all of the activity is below the settlement then it is said to be 100% net short. The overnight inventory situation matters most and has the most impact on early trade when it is skewed 100% in either direction because when the imbalance is very large like that then the odds of an early correction increase greatly. This is due to the fact that most... that is fully within range. Day timeframe odds of success will increase the later you get into the session as there is little premarket indication as to how the early trade will go.
Yesterday’s RTHRegular Trading Hours. In the /ES this means the price action from 9:30am EST to 4:15pm EST only. distribution left a second poor-ish high in as many days. We call that lack of material excess if there are about 2-4 ticks of excess. Printing these sessions back to back is very noteworthy and should be entered into your narrative. Both sessions are in need of repairA market profile term for "fixing" profile distributions that are missing parts that would make them complete or more symmetrical. This concept is most often applied to poor highs and poor lows which are profile distributions that lack excess on their endpoints and have two or more TPO's across creating tops or bottoms that look flat. Once a new session trades through these levels then it is as though the current activity was "pasted onto" the prior activity to complete the picture. It should be noted that repair can only occur in an RTH session. Overnight activity that trades through areas of poor RTH structure does not repair that structure. More and when they stack like that the effect is often exponential.
Above current prices we continue to leave plenty of market profileA way of reading the market that recognizes either time spent or volume traded at a particular price level. A market profile can be either made up of “TPO’s” (time price opportunities), or volume. TPO’s measure how much time was spent at a particular price, while volume-based market profiles measure how much volume traded at a particular price. Generally, market profile is used in the trading of futures, especially the /ES. ShadowTrader utilizes volume based profiles. nuance such as Single PrintsAny section of the market profile distribution that is only one TPO wide. Single prints are a sign of emotional buying or selling as very little time was spent at those levels and thus there is no value there. The endpoints of single print sections are considered to be potential support or resistance points. and VPOC’s untested. Think of that as short term bearish. More accurately, bearish until it isn’t. Those areas should be getting tested, so the lack of interest is bearish and if they get cleaned up then it is less so.
VPOC’s
- 12.14 4078.00
- 12.12 3989.25
- 12.15 3927.00
- 12.21 3904.00
Scenarios
- With back to back RTHRegular Trading Hours. In the /ES this means the price action from 9:30am EST to 4:15pm EST only. Highs that are lacking material excess, the setup for a long trade is obviously over these levels. Monitor for continuation and target sequentially, starting with the Bottom of the Singe Prints from 12.21 and on from there.
- Holding inside of range today would continue the neutral to bearish tone. Pay close attention to what the /NQ is doing today as it has been much relatively weaker recently. The lows of 10.13 as discussed in the video above would be in play.

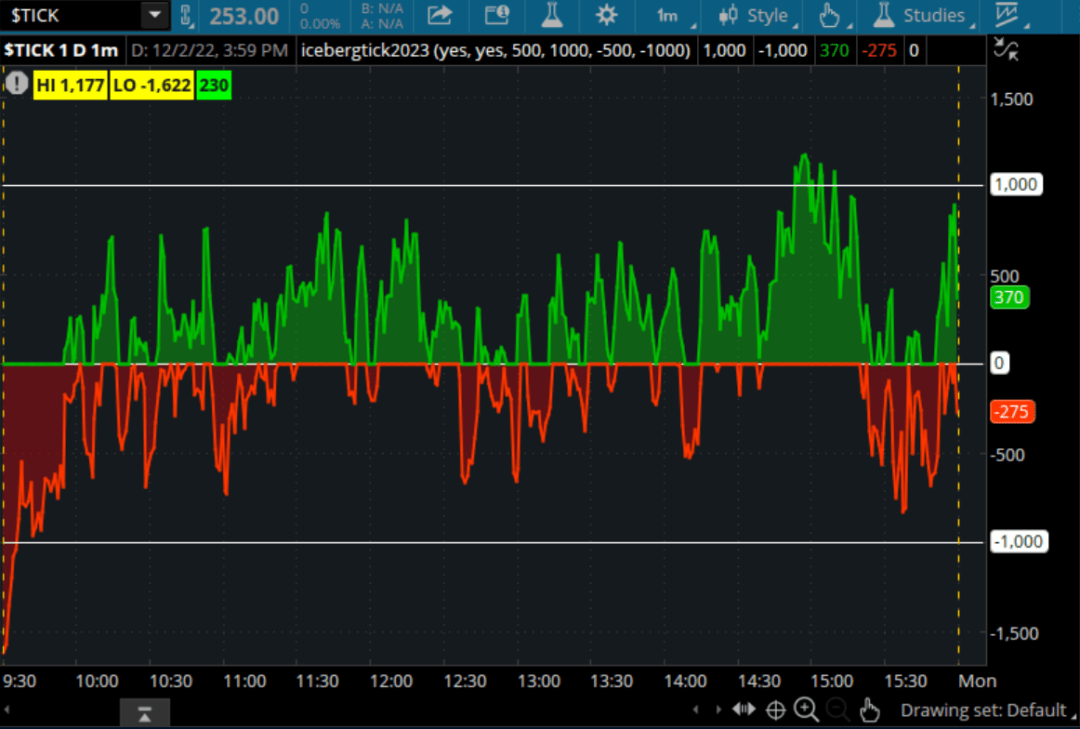
Iceberg Tick
A game changer if you use the TICKThe net cumulative tick reading on the NYSE or Nasdaq Composite. This is measured by the number of stocks ticking up minus the number of stocks ticking down at any given moment. It is the least used of the internal indicators but is discussed from time to time. Generally the tick readings are only helpful when they are at extremes such as +1000 on the NYSE to indicate that program trading is ensuing. as a market internal. Paints time spent above zero in green and time below in red. Traders who know how to use the TICKThe net cumulative tick reading on the NYSE or Nasdaq Composite. This is measured by the number of stocks ticking up minus the number of stocks ticking down at any given moment. It is the least used of the internal indicators but is discussed from time to time. Generally the tick readings are only helpful when they are at extremes such as +1000 on the NYSE to indicate that program trading is ensuing. know that this is what really matters in terms of sustaining intraday direction, not how high or low the extremes are.
LEARN MORE


